Showing posts with label 3D Clouds. Show all posts

Wednesday, May 17, 2023

2023 AWT Spring Experiment in full swing

The AWT is hosting meteorologists from across the country for our spring experiment! This week, participants from the Meteorological Developement Lab (MDL), Global Systems Lab (GSL), FAA Aviation Weather Demenstration and Evaluation (AWDE), Alaska Aviation Weather Unit (AAWU)/Alaska Region, Honolulu Forecast Office (HFO)/Pacific Region, and various Center Weather Service Units and Forecast Offices are here to help evaluate products and provide their insite and expertise.
Participants diagramming workflows for Hazard Services
There are three areas of focus this year: evaluating the 3-dimensional cloud forecasts from the RRFS, creation and discussion of prototype probabalistic graphics and how to present information to the general aviaiton community, and developing and evaluating workflows for Hazard Services for aviation.
Using various resources to create probabilistic forecasts

Wednesday, August 21, 2019

Evaluating 3D Cloud Guidance

One of the focus areas for this year's experiment is evaluating three-dimensional cloud model guidance.  Participants are assessing current post-processing algorithms of cloud layers and the added benefits of experimental visualization capabilities.  In order to complete the evaluation and carefully assess the different guidance products available, the participants have been tasked with creating a detailed text forecast for five specific hours: 15Z, 18Z, 0Z, 9Z, and 12Z the next day.


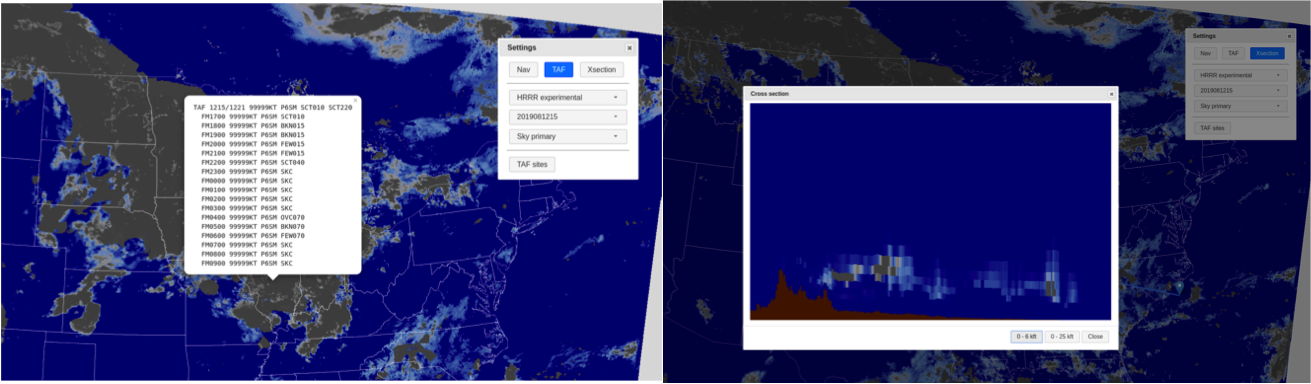
In order to get a better visualization of the 3D cloud information, AWT developed a web interface that allows for better interrogation of the data.  The web interface displays the post-processed gridded output from various model guidance options including three cloud bases and corresponding sky coverage for each forecast hour from the the latest several model runs, as well as the model derived ceiling and visibility.  In addition to the single layer look at the information, the tool allows for creating point-and-click TAFs as well as cross-sections of the cloud layer information along a path.


Along with the descriptive cloud forecasts, the participants will be answering questions about the performance of the various guidance products, any notable strengths or weaknesses, and any biases identified as well.  The various guidance products available include experimental versions of the HRRR and RAP models, the NAM and NAM Nest, and the HIRES ARW, MEM2, and the NMMB.  The experimental 3D RTMA is also available for use as a cloud layer analysis for verification purposes. 


After day one, it was clear that the cross-section ability has several advantages and could be useful for multiple users. While it may not be the primary tool used to forecast ceilings, they could prove beneficial to bolster confidence in a cloud layer occurring or in seeing a thin low cloud deck or fog.  Forecasters may not have the time to look through multiple cross sections for multiple forecast hours, however they could use it to confirm a secondary layer or get a better idea of what the model is trying to tell them in terms of the cloud development.  However, pilots may find the tool extremely useful for planning along a flight path, especially if there could be a time element added in which conditions match the time in which they expect to be flying through that region.

In terms of model performance thus far, participants have been impressed with the HRRRx cloud placement in the vertical more accurately hitting the cloud bases and coverage.  This verified well on Day 1 with the stratus off the coast of California and cloud placement in the north east associated with late afternoon convection.  Overall, so far it seems the guidance tends to agree with cloud occurrence and conditions, but differ on timing and placement.

The experimental HRRR cloud base primary indicating low ceiling moving into the Sacramento valley via the delta breeze. 


Evaluations will continue through the week with specific areas of focus being determined each morning based on impacts for that day and the next.


Tuesday, August 20, 2019

Day 1 of the 2019 AWT Summer Experiment


The 2019 AWT Summer Experiment kicked off on Monday with a full house of collaborators and stakeholders from multiple entities of the aviation weather enterprise. Participants include developers from NOAA’s Earth System Research Lab (ESRL), NWS’s Meteorological Development Lab (MDL), and NCEP’s Environmental Modeling Center (EMC); meteorologists from each NWS region including Alaska and Hawaii, Deutscher Wetterdienst (German weather agency), and Southwest Airlines; as well as stakeholders from NWS headquarters, the US Air Force 557th Weather Wing and the FAA’s Aviation Weather Research Program (AWRP).


There are three major themes that will be explored throughout the week. The first is an evaluation of new features and capabilities in the Graphical Forecasts for Aviation (GFA) and Helicopter Emergency Medical Services (HEMS) web tools.


The Graphical Forecasts for Aviation (GFA) was recently expanded operationally to include the western Atlantic, Gulf of Mexico, and Caribbean Sea in order to give end-users graphical alternatives to the current text-based Area Forecasts still issued for that region. The AWT is also demonstrating additional geographical expansions over much of the Pacific, including Hawaii, and north into Alaska where user feedback will be critical. AWC will be updating the gridded ceiling and visibility (C&V) analysis in the HEMS tool this coming spring and is seeking user feedback on this, as well as some other potential updates to the tool, during the week long experiment.


In addition to the meteorologists and developers on hand to evaluate these updated web tools, pilots will be attending the AWT in person and remotely to provide feedback to human factors experts from the FAA Aviation Weather Demonstration and Evaluation (AWDE) services group. This feedback is critical to ensuring AWC's products continue to evolve to meet the needs of the users most dependent on them.


The second area of focus for the week will be evaluating new cloud layer guidance derived from numerical model 3-D cloud information. Participants will be given the task to create a forecast for cloud evolution over an area with expected aviation impacts. They will have various visualization tools to use in order to examine the 3D cloud information including a point-and-click TAF capability and a point to point cloud cross section viewer. The goal is to have an evaluation of the guidance itself to better tailor post-processing and tooling, as well as how 3D cloud information can be used to improve aviation forecasts in the future.


Finally, AWT participants will be looking at potential extended-range convective guidance products. National traffic planning is increasingly looking at the next day and beyond to better get ahead of potential impacts before they start affecting the NAS, and determining the best path forward in how to present this information to all stakeholders involved is critical.

Stay tuned for updates throughout the week and early findings from each desk!