Showing posts with label Turbulence. Show all posts

Tuesday, February 19, 2013

Low Level WInd Shear Probabilities

We are evaluating two ensemble forecasts of low level wind shear (LLWS). LLWS is one of the hazards that are forecast as part of our turbulence package.  Both the AFWA and SREF have been post-processed to produce a probabilistic forecast of low level (0-2000 feet AGL) greater than 30kts.

09Z SREF run on 19 Feb, LLWS probabilities between 21Z Feb 19 - 09Z Feb 21.
12Z AFWA run on 19 Feb, LLWS probabilities between 21Z Feb 19 - 09Z Feb 21.

Visualization of Turbulence Layers

The AWC produces the Graphical Turbulence Guidance as part of its suite of automated supplemental aviation forecast products.  A forecast of eddy dissipation rate is produced at 21 different horizontal flight levels, and is typically visualized either on these 21 flight levels or as a composite, which is the maximum value in the atmospheric column.
15 GTG forecast from 19 Feb, valid at 21Z.  Loop starts at the bottom of the atmosphere and shows the EDR values at each vertical level between FL100 and FL450.
15 GTG forecast from 19 Feb, valid at 21Z.  This composite chart shows the maximum value between FL100 and FL450.
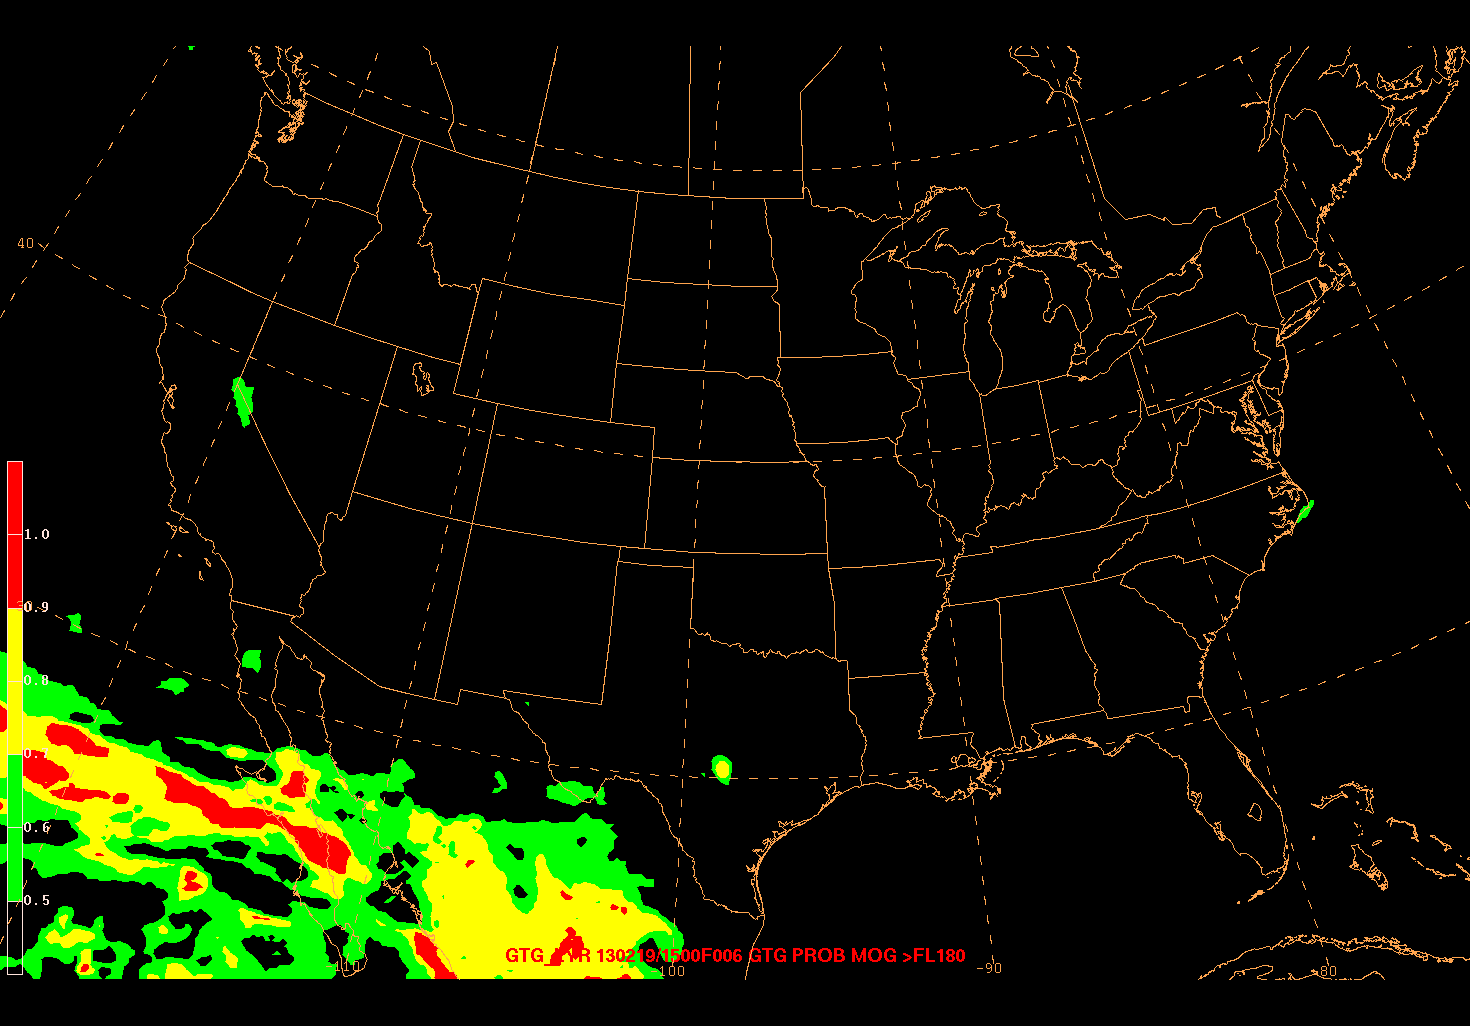
Only viewing the GTG product in this manner necessitates an analysis of each of the vertical levels to ascertain the vertical characteristics of where the turbulence is forecast.  Since turbulence forecasts at the AWC are issued for high-level and low-level turbulence, which are split at 18,000 ft MSL.  Shown below are the probability of moderate or greater (MOG) turbulence above, and below FL180, respectively.  Probability in this application is defined as the percent of layers with MOG turb.
Probability of Moderate or Greater Turbulence above FL180. The probability is defined as the percentage of layers that have moderate or greater.
Probability of Moderate or Greater Turbulence below FL180.  The probability is defined as the percentage of layers that have moderate or greater.
An additional visualization that is being tested is the base and tops of moderate turbulence.  This is computed using a top-down (bottom-up) search for the first level of moderate or greater turbulence.  Un-shaded portions of these plots are regions where forecast turbulence does not reach a moderate intensity.  This can provide a quick view of the vertical extent of turbulence, although there may be layers between the tops and bases that do not reach a moderate intensity.
Bases of Moderate or Greater Turbulence.

Tops of Moderate or Greater Turbulence.

Pattern Recognition in Turbulence Guidance

Part of forecasting the weather is being able to recognize patterns in meteorological features.  Below is an image from the today's 06Z issuance of the Global Graphical Turbulence Guidance produced by NCAR.  Any experienced forecaster will immediately recognize this as Sad Turbulence.
Sad Turbulence

Thursday, February 14, 2013

Turbulence Guidance

This post will highlight some of the turbulence guidance being used and evaluated in the testbed during the experiment.  The valid times are 13 Feb 21Z - 14 Feb 09Z.

The first two images below are guidance that is available on our operations floor.  To get a general idea of the pattern, the 300 hPa heights, winds and isotachs are plotted.  The second image shows the Ellrod-Knox Turbulence Index for the same period, which is highlighting a region of enhanced turbulence along the east coast developing along the shear zones of the ridge.

13 Feb 12Z NAM forecast of 300 hPa heights and winds.
13 Feb 12Z NAM forecast of 300-400 hPa Ellrod-Knox Turbulence Index.
For the experiment, we have been looking at several different high-resolution forecasts of turbulence.  The first is a probabilistic forecast of turbulence from the AFWA ensemble between 25,000 and 30,000 feet.  The second is an explicit prediction of Turbulent Kinetic Energy (TKE) from the WRF-NMM run at 00Z and 12Z for the Storm Prediction Center.  Plotted is the maximum value over the previous hour in the layer between 200 and 500 hPa.
13 Feb 00Z AFWA forecast of probability of turbulence for FL250-300.
13 Feb 12Z SPC WRF-NMM forecast of hourly max TKE between 200-500 hPa.
Looking at these different solutions, all have the ribbon of turbulence along the east coast jet, but the location of the maximum differs depending on the predictor.  A loop of water vapor imagery for this period is shown below.  Overlaid on this loop are automated aircraft observations of Eddy Dissipation Rate (EDR), which are an objective measure of turbulent eddies in the atmosphere, as well as subjective Pilot Reports (PIREPs).  Toward the end of the period, a Turbulence SIGMET was issued off the New England coast.
GOES-East Water vapor imagery with EDR observations from aircraft and Turbulence SIGMETs.

Tuesday, February 12, 2013

Day 2: Afternoon Transportation Briefing

As part of the first week of the 2013 Winter Weather Experiment, the Aviation Weather Testbed is working with the HPC Winter Experiment to produce a collaborative transportation briefing.
In addition to collaboration with the HPC, this forecast was also produced with collaborations involving NWS WFO forecasters and the experimental Global Graphics forecasting desk that is part of the experiment.

One of the AWC National Aviation Meteorologists (stationed at the FAA System Command Center) is participating in the HPC Experiment this week and is focusing on communicating precipitation types and timing.  The graphic below was produced by an AWC forecaster in Kansas City and focuses on the icing, turbulence, and IFR conditions associated with a system that is forecast to impact the east coast on Feb 14-15.
Transportation briefing graphic valid 14 Feb 00Z - 15 Feb 00Z.  Depiction of IFR, icing, turbulence, and wind threats associated with forecast cyclone.

One of the automated tools that is available to forecasters and air traffic planners is the Aviation Winter Weather Dashboard.  The dashboard translates winter weather as forecast by the SREF into terminal impacts based on how well the airport can handle certain winter weather events.  Below is a snapshot of the dashboard showing terminal impacts in the northeast as forecast by the 09Z SREF on 12 February.

Aviation Winter Weather Dashboard showing terminals in the Northeast.  Forecast from the 09Z SREF on 12 Feb.