Showing posts with label AWC. Show all posts

Wednesday, June 26, 2024

Taking a look at how AWC forecasters can provide decision support to the GA community

Aviation Weather Center has continuously received feedback from their pilot partners that they would like to have an easy to interpret, quick glance graphic that gives them an idea of what hazards to expect in the coming days. Testbed participants are tasked with developing sample graphics for both a “Key Aviation Message”, similar to the Key Messages developed by local forecast offices, and Days 2 and 3 outlooks for aviation hazards.

Participants looking at various data products to develop outlook graphics

The goal of the Key Aviation Message is to communicate an impactful weather event occurring in the NAS that may cause general aviation (GA) pilots the need to alter their flight plans. These decision support graphics are intended to be sent out a couple times a day, for this experiment specifically testing once in the morning for the day of events, and a separate graphic in the afternoon or evening covering a major area of concern for the following day. A big aim for our participants this week is to help hone in on what information is important to share with pilots and how we can help local weather forecast offices (WFO) share aviation hazards. Participants reiterated the importance of using plain language and focusing on our GA pilot audience for flight levels and impacts. A couple other ideas participants noted were the importance of including a valid time or next issuance update time, and using local time vs zulu. The WFO participants mentioned sharing the graphics on their social media, in addition to AWC social media, if their area is impacted to help reach a larger audience!

Sample Key Aviation Message outlining icing conditions in the Pacific Northwest

One of the most repeated requests from GA pilots is for a longer term outlook at what the weather may look like in the next couple days. AWT has taken a look at outlook graphics which cover the day 2 and 3 time frames in the past and have come up with some questions about how to show this larger temporal resolution graphic, identifying what aviation hazard criteria must be met in order to be included, and how to provide this quick glance first look. This experiment, our participants created three separate graphics to show these hazards out to day 2. The day 2 (next day) outlook was divided into a morning and afternoon/evening forecast, and day 3 covered the entirety of the daytime flying.

Sample Day 2 PM Outlook graphic drawn by participants and overlaid with fronts

Guidance was provided for criteria which must be met for each aviation hazard, based on standards for GA pilots. As participants drew their outlooks, internal discussions covered the importance of having two separate day 2 graphics and how useful this additional outlook will be for GA pilots looking to plan out in the next couple days. Some ideas for AWT to further investigate include the possibility of adding text information, constraints of layer colors or outlines, or additional toggles when they are displayed on the website. As we continue to solidify how these outlooks may look, the next big step will be to get the graphic in front of users to really assess the intuitiveness and utility of the product for its intended users!

Monday, April 1, 2024

AWT Spring Experiment 2024 is Ready to Welcome Guests

Tomorrow starts the first day of the 2024 AWT Spring Experiment. This year the AWT is running two different “mini” experiments, one in the spring and one in the summer, in order to separate the different areas of focus and really hone in on each focal point. This spring, the AWT is welcoming meteorologists from various Center Weather Service Units and Forecast Offices, Global Systems Lab (GSL), Alaska Aviation Weather Unit (AAWU)/Alaska Region, Environmental Modeling Center (EMC), Southwest Airlines, and the FAA Weather Division to assist in assessing products and offer valuable insights and expertise.

GTG data available on the testbed webpage with an example G-AIRMET overlaid

This spring the participants will have two main areas of focus: evaluating the Rapid Refresh Forecast System while creating experimental G-AIRMETs on the testbed website, and providing insight on how AWC can enhance their collaboration to core partners by investigating the viability of a National Aviation Operations Center (NAOC) desk deployed within operations at AWC.

AWC Forecaster providing weather information for aviation partners

Thursday, August 13, 2020

AWDE Services Gathers Probabilistic TCF Feedback


The Aviation Weather Demonstration and Evaluation (AWDE) Services team provided support to the
Aviation Weather Testbed (AWT) during the two-week, all virtual, 2020 Summer Experiment. AWDE
conducted interviews with twenty-one participants to collect feedback concerning the capabilities
incorporated into the probabilistic TCF product. Participants included CWSU meteorologists, PERTI team
members, one MIC, and one NAM. All participants attended 30-60 minute virtual interviews and
provided valuable feedback concerning the operational suitability and usability of the probabilistic TCF
product.


AWDE team members asked participants questions concerning the overall usability, how the products
capabilities would add value in an operational environment, and what would improve the product’s
suitability and usability. All participants gave feedback stating the product is a good first-look graphic
that provides an overview of convective regions nationwide for planning. This graphic would be used
alongside models to compare convective focus areas for planning. Additional overlays such as ARTCC
boundaries, jet routes, and airport locations would be useful. While the product provides a 24 hour
convective forecast, most participants would benefit from smaller time increments, such as three or six
hours, and be able to focus in on certain regions/areas. The ability to overlay MRMS and the final TCF
polygons as verification provided more confidence in using the probabilistic TCF product to identify
convective weather areas.

Overall, the consensus among participants is that the product would be used as an initial tool to identify
convective areas to focus on before analyzing more regionalized areas for day one planning.

Tuesday, August 11, 2020

Verification and Reliability of Probabilistic Information

When evaluating a product to determine it's usefulness, it is important to know how well it is performing. Verifying probabilistic information is a tricky problem. It's much easier to validate a deterministic product by looking at observations of what occurred. For this evaluation, we're offering two methods for users to utilize to look at how well the probabilistic information performed. 

The first option allows for overlaying “observed” TCF polygons on past runs. These polygons are generated from MRMS reflectivity and echo tops over the entire 24 hour period. This verification product is available on the AWC main website via the TCF page. To get a sense of what these polygons look like with the corresponding MRMS reflectivity, check out the graphic below. 

An example of the MRMS polygon verification product, showing how the polygons are generated around MRMS reflectivity that meets the TCF criteria.

The MRMS option is intended to serve as a subjective verification, of sorts, comparing how the guidance performed against observations. The polygons are color coded by valid times that occur during the 24hr period represented by the guidance probability contours. An example of what this looks like can be seen in the graphic below, with the MRMS generated polygons overlaid on top of a past HRRRe 24hr graphic.

An example of the TCF probabilistic HRRRe 24hr graphic overlaid with "observed" MRMS polygons from the same time period. 

Another way users can get a sense of how well the probabilistic product performed is by overlaying the final 4-hr TCF polygons generated by the AWC forecaster throughout the 24hr period. The Final 4-hr TCF option is intended to allow for comparison between the performance of the automated probabilities and the forecaster generated polygons, allowing users to see if there are areas that were captured by the forecasters, but not the probabilities, or vice versa. An example of this can be seen below.

An example of the TCF probabilistic HREF 24hr graphic overlaid with the Final 4-hr TCF polygons color coded by valid time.

In addition to overlaying observed data onto the probabilistic information, users can also look at the reliability of each guidance product (HREF & HRRRe) by model run. The reliability statistics are computed and plotted for each guidance run using TCF polygons generated from MRMS reflectivity and echo tops as observations. These reliability diagrams give an assessment of the performance of probabilistic guidance in terms of its reliability, or whether the probabilities tend to over-predict or under-predict the occurrence of a phenomenon. 


In the above example, both models performed fairly well for this run, staying close to the center diagonal line which would indicate a perfect forecast. In this case, the HREF slightly over-predicted the probability values while the HRRRE slightly under-predicted the probability of occurrence. While this capability is currently only available by run, AWC plans to combine full statistics to get a better sense of overall performance during the experiment and beyond. There has also been early feedback indicating users would also like to see this information broken down by region.

While probabilistic information continues to be a challenge to fully verify, users seem to appreciate the various methods AWC has explored to give them a sense of model guidance performance and reliability. Other potential means to discern this information has been a topic of discussion among participants and stakeholders throughout the experiment thus far.


Thursday, August 6, 2020

The 2020 Summer Experiment Has Gone Virtual!

Like so many other things in 2020, the Summer Experiment has gone virtual! While we sure do miss seeing and interacting with our partners and stakeholders in the testbed, we are excited to be able to keep the tradition going by continuing to evaluate and evolve products for the aviation community!


In order to facilitate an evaluation in the virtual realm, we are focusing on one product with a more targeted participant list. In keeping with one of the themes from recent experiments, we're focusing on convection in the next-day planning regime. For that reason our targeted participants include forecasters from the various Center Weather Service Units (CWSU) which are co-located within the FAA's Air Route Traffic Control Centers (ARTCC). These forecasters often collaborate with Aviation Weather Center (AWC) forecasters on the Traffic Flow Management Convective Forecast (TCF) creation and have a breadth of knowledge on how convection impacts planning in the National Airspace System (NAS). 

Map of CWSU coverage areas over the contiguous United States.


While we have looked at the idea of impact graphics for utilization in longer term planning for the NAS, this time we are bringing in probabilistic information to address uncertainty and start to better understand how this information can best be used in the planning environment.  For this evaluation, we are utilizing convective allowing ensemble guidance to diagnose the probability of convection exceeding TCF criteria. 

An example of the TCF Probability graphic highlighting the probability of sparse coverage of convection


Guidance imagery, depicting the probability of exceeding sparse and medium coverage TCF thresholds, will be automatically generated from two different model sources twice per day, in the early morning and early afternoon. Evaluation of the guidance by participants will help us meet the following goals

  • Assess the usefulness of 24 hour summary information of TCF focused threats
  • Identify optimal ways to provide, interpret, and communicate probabilistic convective information
  • Assess the skillfulness of convection allowing ensemble systems for aviation focused convective forecasts
To help facilitate gathering feedback from our participants, we are once again partnering with the FAA's Aviation Weather Demonstration and Evaluation (AWDE) Services group.  Throughout the week they will help us assess the usability and utility of this product from the user's perspective via one-on-one interviews and a questionnaire. We will also have two large group discussions during which additional stakeholders will be invited to provide their perspective and input. 

Stay tuned for early results and key takeaways from the experiment!

Wednesday, August 21, 2019

Evaluating 3D Cloud Guidance

One of the focus areas for this year's experiment is evaluating three-dimensional cloud model guidance.  Participants are assessing current post-processing algorithms of cloud layers and the added benefits of experimental visualization capabilities.  In order to complete the evaluation and carefully assess the different guidance products available, the participants have been tasked with creating a detailed text forecast for five specific hours: 15Z, 18Z, 0Z, 9Z, and 12Z the next day.


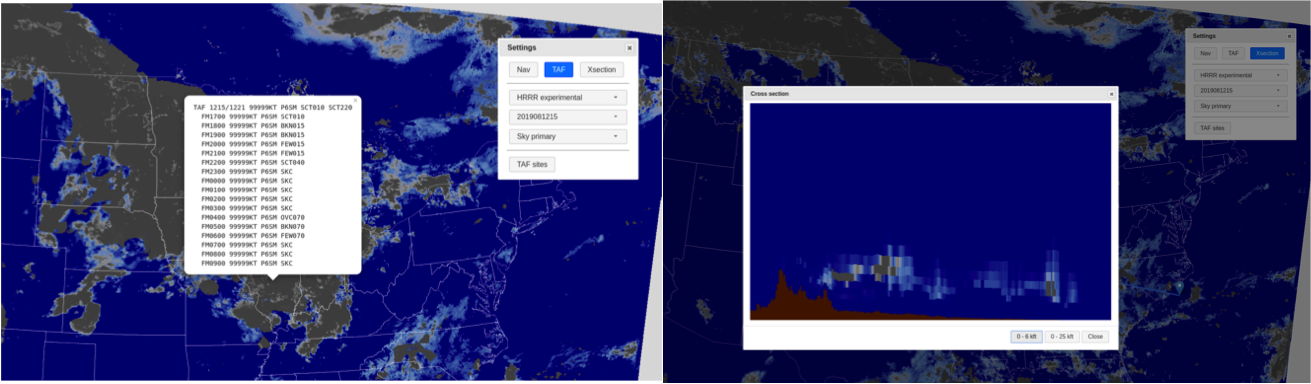
In order to get a better visualization of the 3D cloud information, AWT developed a web interface that allows for better interrogation of the data.  The web interface displays the post-processed gridded output from various model guidance options including three cloud bases and corresponding sky coverage for each forecast hour from the the latest several model runs, as well as the model derived ceiling and visibility.  In addition to the single layer look at the information, the tool allows for creating point-and-click TAFs as well as cross-sections of the cloud layer information along a path.


Along with the descriptive cloud forecasts, the participants will be answering questions about the performance of the various guidance products, any notable strengths or weaknesses, and any biases identified as well.  The various guidance products available include experimental versions of the HRRR and RAP models, the NAM and NAM Nest, and the HIRES ARW, MEM2, and the NMMB.  The experimental 3D RTMA is also available for use as a cloud layer analysis for verification purposes. 


After day one, it was clear that the cross-section ability has several advantages and could be useful for multiple users. While it may not be the primary tool used to forecast ceilings, they could prove beneficial to bolster confidence in a cloud layer occurring or in seeing a thin low cloud deck or fog.  Forecasters may not have the time to look through multiple cross sections for multiple forecast hours, however they could use it to confirm a secondary layer or get a better idea of what the model is trying to tell them in terms of the cloud development.  However, pilots may find the tool extremely useful for planning along a flight path, especially if there could be a time element added in which conditions match the time in which they expect to be flying through that region.

In terms of model performance thus far, participants have been impressed with the HRRRx cloud placement in the vertical more accurately hitting the cloud bases and coverage.  This verified well on Day 1 with the stratus off the coast of California and cloud placement in the north east associated with late afternoon convection.  Overall, so far it seems the guidance tends to agree with cloud occurrence and conditions, but differ on timing and placement.

The experimental HRRR cloud base primary indicating low ceiling moving into the Sacramento valley via the delta breeze. 


Evaluations will continue through the week with specific areas of focus being determined each morning based on impacts for that day and the next.


Tuesday, August 20, 2019

Day 1 of the 2019 AWT Summer Experiment


The 2019 AWT Summer Experiment kicked off on Monday with a full house of collaborators and stakeholders from multiple entities of the aviation weather enterprise. Participants include developers from NOAA’s Earth System Research Lab (ESRL), NWS’s Meteorological Development Lab (MDL), and NCEP’s Environmental Modeling Center (EMC); meteorologists from each NWS region including Alaska and Hawaii, Deutscher Wetterdienst (German weather agency), and Southwest Airlines; as well as stakeholders from NWS headquarters, the US Air Force 557th Weather Wing and the FAA’s Aviation Weather Research Program (AWRP).


There are three major themes that will be explored throughout the week. The first is an evaluation of new features and capabilities in the Graphical Forecasts for Aviation (GFA) and Helicopter Emergency Medical Services (HEMS) web tools.


The Graphical Forecasts for Aviation (GFA) was recently expanded operationally to include the western Atlantic, Gulf of Mexico, and Caribbean Sea in order to give end-users graphical alternatives to the current text-based Area Forecasts still issued for that region. The AWT is also demonstrating additional geographical expansions over much of the Pacific, including Hawaii, and north into Alaska where user feedback will be critical. AWC will be updating the gridded ceiling and visibility (C&V) analysis in the HEMS tool this coming spring and is seeking user feedback on this, as well as some other potential updates to the tool, during the week long experiment.


In addition to the meteorologists and developers on hand to evaluate these updated web tools, pilots will be attending the AWT in person and remotely to provide feedback to human factors experts from the FAA Aviation Weather Demonstration and Evaluation (AWDE) services group. This feedback is critical to ensuring AWC's products continue to evolve to meet the needs of the users most dependent on them.


The second area of focus for the week will be evaluating new cloud layer guidance derived from numerical model 3-D cloud information. Participants will be given the task to create a forecast for cloud evolution over an area with expected aviation impacts. They will have various visualization tools to use in order to examine the 3D cloud information including a point-and-click TAF capability and a point to point cloud cross section viewer. The goal is to have an evaluation of the guidance itself to better tailor post-processing and tooling, as well as how 3D cloud information can be used to improve aviation forecasts in the future.


Finally, AWT participants will be looking at potential extended-range convective guidance products. National traffic planning is increasingly looking at the next day and beyond to better get ahead of potential impacts before they start affecting the NAS, and determining the best path forward in how to present this information to all stakeholders involved is critical.

Stay tuned for updates throughout the week and early findings from each desk!