Wednesday, June 26, 2024

Taking a look at how AWC forecasters can provide decision support to the GA community

Aviation Weather Center has continuously received feedback from their pilot partners that they would like to have an easy to interpret, quick glance graphic that gives them an idea of what hazards to expect in the coming days. Testbed participants are tasked with developing sample graphics for both a “Key Aviation Message”, similar to the Key Messages developed by local forecast offices, and Days 2 and 3 outlooks for aviation hazards.

Participants looking at various data products to develop outlook graphics

The goal of the Key Aviation Message is to communicate an impactful weather event occurring in the NAS that may cause general aviation (GA) pilots the need to alter their flight plans. These decision support graphics are intended to be sent out a couple times a day, for this experiment specifically testing once in the morning for the day of events, and a separate graphic in the afternoon or evening covering a major area of concern for the following day. A big aim for our participants this week is to help hone in on what information is important to share with pilots and how we can help local weather forecast offices (WFO) share aviation hazards. Participants reiterated the importance of using plain language and focusing on our GA pilot audience for flight levels and impacts. A couple other ideas participants noted were the importance of including a valid time or next issuance update time, and using local time vs zulu. The WFO participants mentioned sharing the graphics on their social media, in addition to AWC social media, if their area is impacted to help reach a larger audience!

Sample Key Aviation Message outlining icing conditions in the Pacific Northwest

One of the most repeated requests from GA pilots is for a longer term outlook at what the weather may look like in the next couple days. AWT has taken a look at outlook graphics which cover the day 2 and 3 time frames in the past and have come up with some questions about how to show this larger temporal resolution graphic, identifying what aviation hazard criteria must be met in order to be included, and how to provide this quick glance first look. This experiment, our participants created three separate graphics to show these hazards out to day 2. The day 2 (next day) outlook was divided into a morning and afternoon/evening forecast, and day 3 covered the entirety of the daytime flying.

Sample Day 2 PM Outlook graphic drawn by participants and overlaid with fronts

Guidance was provided for criteria which must be met for each aviation hazard, based on standards for GA pilots. As participants drew their outlooks, internal discussions covered the importance of having two separate day 2 graphics and how useful this additional outlook will be for GA pilots looking to plan out in the next couple days. Some ideas for AWT to further investigate include the possibility of adding text information, constraints of layer colors or outlines, or additional toggles when they are displayed on the website. As we continue to solidify how these outlooks may look, the next big step will be to get the graphic in front of users to really assess the intuitiveness and utility of the product for its intended users!

Monday, June 24, 2024

AWT Summer Experiment 2024 Starts Tomorrow!

The AWT welcomes a new set of guests back for the second experiment of 2024. This three day 2024 AWT Summer Experiment will run from June 25-27th in the Aviation Weather Center Testbed. As the second of two experiments this year; AWT is continuing on from the RRFS evaluation this spring, one desk is focusing on new convective products and working in collaboration with the National Severe Storms Laboratory (NSSL) the kick off the Warn on Forecast System (WoFS) assessment with our CWSU partners, and the other focus area will be taking a look at how another future new AWC forecast desk may bring further collaboration for aviation within the National Weather Service.

Testing out new outlook graphics in AWIPS to display on the testbed website

Visitors from various Center Weather Service Units and Forecast Offices, National Severe Storms Laboratory (NSSL), Space Weather Prediction Testbed (SWPT), Meteorological Development Laboratory (MDL), FAA Aviation Weather Demonstration and Evaluation Services (AWDE), NCEP Social Science, Univ. of Oklahoma, and Southwest Airlines will be here to provide valuable input and share new ideas.

The WoFS drawing tool in action

Thursday, April 4, 2024

Enhancing collaboration between AWC and Core partners

There is a growing emphasis on improved collaboration and communication regarding anticipated aviation hazards to ensure a uniform aviation forecast across the National Weather Service (NWS). Participants at the AWT Spring Experiment are navigating what this collaboration may look like as a new forecast desk, National Aviation Operations Center (NAOC), within the operations at AWC.

Throughout the week, participants are simulating some of the tasks that may be done by an AWC lead forecaster at the NAOC desk and providing feedback based on the utility of the collaboration for their own operations. One major task for the forecasters is to develop and conduct a mock national collaboration call targeted for internal NWS aviation forecasters to ensure we are drawing the same picture regarding weather impacts to the NAS. Utilizing a new “briefing tool” on the testbed website, our participants collected the information they thought would be most useful for our CWSU partners and presented a mock call. Participants discussed the timing of these calls and how they might affect our partners differently from mornings on the east coast in the swing of things to the west coast still waking up.

AWC lead forecaster Joey Welsh working on creating a collaboration call briefing package

Participants are also exploring how AWC might create a decision support graphic depicting the “Key Aviation Message” of the day. This graphic is aimed towards providing general aviation pilots a targeted picture of major impacts within the NAS. While exploring different tools to create a graphic, the participants spent time honing in on what they considered the most major impact and how to relay this information to the GA community.

Monday, April 1, 2024

AWT Spring Experiment 2024 is Ready to Welcome Guests

Tomorrow starts the first day of the 2024 AWT Spring Experiment. This year the AWT is running two different “mini” experiments, one in the spring and one in the summer, in order to separate the different areas of focus and really hone in on each focal point. This spring, the AWT is welcoming meteorologists from various Center Weather Service Units and Forecast Offices, Global Systems Lab (GSL), Alaska Aviation Weather Unit (AAWU)/Alaska Region, Environmental Modeling Center (EMC), Southwest Airlines, and the FAA Weather Division to assist in assessing products and offer valuable insights and expertise.

GTG data available on the testbed webpage with an example G-AIRMET overlaid

This spring the participants will have two main areas of focus: evaluating the Rapid Refresh Forecast System while creating experimental G-AIRMETs on the testbed website, and providing insight on how AWC can enhance their collaboration to core partners by investigating the viability of a National Aviation Operations Center (NAOC) desk deployed within operations at AWC.

AWC Forecaster providing weather information for aviation partners

Thursday, May 18, 2023

AWT Takes Over FPAW

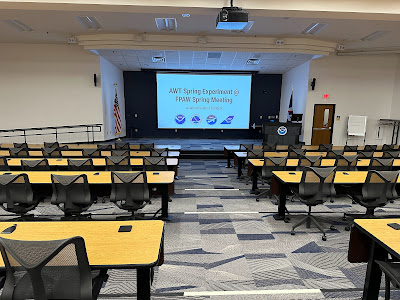
Stakeholders from across the aviation community are in Kansas City this week for the Spring FPAW (Friends and Partners of Aviation Weather) meeting. Today, AWT integrated with FPAW to leverage knowledge and thoughts from users and producers of aviation weather information. The primary focus today was evaluating user interpretation of probabilistic aviation information. Through online polling and discussion, users were able to provide insite on aviation probabilistic products.
AWT presents at FPAW

This morning, we started with an overview of the winter weather dashboard; which is an operational product both on aviationweather.gov and experimental on our beta website. FPAW participants appreciated the demonstration of the dashboard and being able to see plume and model trend data. They also expressed interest in more information on the impact thresholds on the dashboard.

After lunch, FPAW broke into groups to discuss non-deterministic methods for communicating aviation hazards. Utilizing some of the probabalistic desk graphics the testbed participants have been working on during the week, we got a lot of feedback on how the data are presented and how different weather phenonemon impact the general aviation community. Some of the "hot topics" from the participants were focused on how detailed the graphics are or should be, spatial coverage of the polygons, and how pilots versus meteorologists perceive data.
AWT Organizer, Jack Lind, leading discussion on probabilistic graphics

The day wrapped up with a look at the outlooks graphics from last years 2022 AWT Summer Experiment. Good discussion on the time scale of the outlooks, the busyness of a map with all aviation weather impacts, and how adding text to the graphic would enhance an outlook helped AWT hone in on some of the things the general aviation community is looking for in an outlook graphic.

Wednesday, May 17, 2023

2023 AWT Spring Experiment in full swing

The AWT is hosting meteorologists from across the country for our spring experiment! This week, participants from the Meteorological Developement Lab (MDL), Global Systems Lab (GSL), FAA Aviation Weather Demenstration and Evaluation (AWDE), Alaska Aviation Weather Unit (AAWU)/Alaska Region, Honolulu Forecast Office (HFO)/Pacific Region, and various Center Weather Service Units and Forecast Offices are here to help evaluate products and provide their insite and expertise.
Participants diagramming workflows for Hazard Services
There are three areas of focus this year: evaluating the 3-dimensional cloud forecasts from the RRFS, creation and discussion of prototype probabalistic graphics and how to present information to the general aviaiton community, and developing and evaluating workflows for Hazard Services for aviation.
Using various resources to create probabilistic forecasts

Thursday, September 15, 2022

A Look at Developing Outlooks for General Aviation

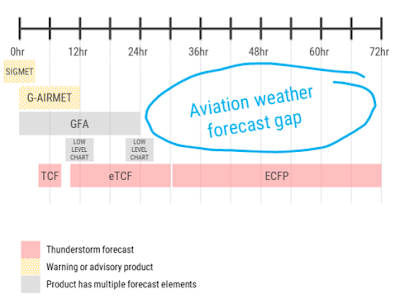
One of the major themes, or desks, of this year's experiment is looking at the potential for creating Outlook Graphics for Days 1, 2, and 3 for AWC's General Aviation (GA) customers. Current AWC operational products do not go out beyond Day1, leaving an information gap (Fig.1) for those that are looking to plan for flights in the coming days. AWC has continuously received feedback from their pilot partners that they would like to have an easy to interpret, quick glance graphic that gives them an idea of what hazards to expect in the coming days.


Fig1. Current aviation weather forecast gap at the Aviation Weather Center for aviation hazards.

Experiment participants were tasked with developing Outlook Graphics that would be valid 12z-12z the following day and depict prolonged, impactful hazards which could include turbulence, IFR, icing, precipitation, smoke, and thunderstorms. The design would be similar to the current National Forecast Charts (Fig2) developed by the Weather Prediction Center, and maintain consistency with existing NWS products (ie. WPC, NHC, NDFD).  Participants used an interactive drawing GUI on the Testbed Website that allowed them to overlay fronts, modify the background map, and draw various polygons for each forecasted hazard.

Fig2. An example of the Weather Prediction Center's National Forecast Chart for Day1.


While ultimately user input will be critical for determining the utility of the Outlook graphics, participants were asked to fucus on things like the design, what guidance to use, what hazards were most impactful and should be included, and the overall workload that would be associated with creating such a graphic. It was clear from day one of the experiment that everyone brought different perspectives and ideas to the table, leading to an active and fun desk throughout the week.

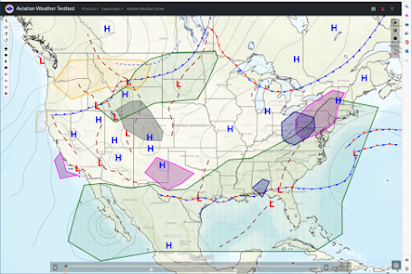
Fig3. An example of one of the Outlook Graphics created during the experiment.


Throughout the week all participants agreed that determining the severity and impact of the graphics for the GA community will be the top priority before moving forward with operationalizing the product. Participants also indicated that a more detailed summary of the impacts with location and timing associated with them would be beneficial for Day1 for both GA fliers and fellow meteorologists. Other ideas that were brought up were the potential for multiple outlook 'tabs' for the various user types (GA, Low Altitude (LA), and National Air Space (NAS) planning), or even breaking up Day 1 into two separate Outlook graphics (morning and afternoon) to account for hazards that are only impactful during those periods.

In the end, the AWT staff recieved an abundance of perspective and ideas for moving the Outlook Graphic further toward operations. The next step will be to get the graphic in front of users to really assess the intuitiveness and utility of the product for its intended users.